Absolute Risk Reduction: A Practical Explainer

A hospital leader sits in a budget meeting with two proposals on the table. One vendor says its program cuts adverse events significantly. Another says its protocol delivers a limited absolute improvement. Both sound plausible. Both sound evidence based. Only one presentation makes it easy to judge what the organization is buying.
That problem appears frequently in clinical operations, quality improvement, pharmacy review, infection prevention, and board reporting. Teams hear a large percentage reduction and assume the effect must be large. Sometimes it is. Sometimes it is not.
Absolute risk reduction is the metric that keeps everyone honest. It tells you the direct difference in bad outcomes between a control group and a treated group. For residents, it sharpens evidence appraisal. For administrators, it turns abstract trial language into staffing, cost, and implementation decisions. For regulated organizations, it supports clearer documentation and more defensible choices.
Beyond the Hype Making Sense of Health Data
A common mistake in healthcare decision-making is treating all “risk reduction” language as interchangeable.
A proposal says an intervention reduces complications by half. That sounds compelling. But if the underlying complication rate was low, the practical gain may be much smaller than the headline suggests. In practice, the difference between relative improvement and absolute improvement can determine whether a program deserves rollout, piloting, or rejection.
What decision-makers need
Hospital administrators rarely need statistics for their own sake. They need answers to practical questions:
- Patient impact: How many patients are spared harm?
- Operational value: Is the benefit large enough to justify training, workflow disruption, or purchasing?
- Communication clarity: Can we explain the effect to clinicians, the board, and patients without overstating it?
That is why absolute risk reduction matters. It answers the simplest useful question: How much did the event rate drop?
For leaders who work across market access, product evaluation, and evidence review, this broader Healthcare Commercial Intelligence Guide is useful background on how healthcare organizations turn evidence into strategic decisions.
Why this matters beyond clinical trials
The same thinking applies outside bedside care. Every regulated organization has to compare baseline risk with residual risk after an intervention. In health systems, that might mean a medication, a protocol, or a device. In IT and compliance operations, teams use similar logic when reducing exposure through controls like secure disposal and data sanitization.
Key takeaway: Large-sounding claims are not automatically wrong. They are often incomplete. Absolute risk reduction supplies the missing context.
If you are reviewing a paper, a vendor deck, or a quality-improvement report, absolute risk reduction is the fastest way to see whether the claimed benefit is substantial, marginal, or mainly a framing effect.
What is Absolute Risk Reduction
The cleanest way to understand absolute risk reduction is to stop thinking about percentages as marketing language and start thinking about them as people.
If a treatment changes the outcome for a group, how many people in that group avoid the bad event because of the treatment? That direct difference is the point.

A simple way to picture it
Think of two waterlines marked on a wall after a flood. One line shows the damage level without protection. The other shows the level after a barrier was installed.
The important question is not “what proportion lower is the second line compared with the first?” The practical question is, “how much lower is the water level in actual terms?” Absolute risk reduction works the same way.
The formal definition
Absolute Risk Reduction = Control Event Rate – Experimental Event Rate
That can also be written as ARR = CER – EER.
Here is what each term means:
Control Event Rate (CER): the rate of the bad outcome in the group that did not receive the intervention.
Experimental Event Rate (EER): the rate of the bad outcome in the group that did receive the intervention.
A concrete example
A clear example appears in this explanation of calculating absolute risk reduction. For example, if the risk of an adverse event is higher in an untreated control group and lower in a treatment group, the ARR reflects this difference. In plain language, the treatment prevents a certain number of cases per 100 patients treated.
That is why absolute risk reduction is so useful. It does not ask the reader to mentally convert a ratio into impact. It states the impact directly.
What readers often confuse
Many people confuse three different ideas:
- Risk itself: the chance that an event happens
- Absolute change in risk: the arithmetic difference between groups
- Relative change in risk: the proportional drop compared with the starting level
Only the second item is absolute risk reduction.
A resident reading a trial abstract may see a striking relative effect and assume the intervention must be effective. An administrator may hear a vendor report a sharp percentage decline and think implementation is obvious. ARR slows that reaction down and grounds it in event differences.
Why clinicians rely on it
Clinicians use ARR because it is easier to translate into patient counseling. Administrators use it because it is easier to translate into program value. Both groups are trying to answer the same question from different angles.
How much harm did this intervention prevent?
When you stay focused on that question, absolute risk reduction becomes one of the most practical concepts in evidence-based medicine.
How to Calculate Absolute Risk Reduction Step by Step
A committee is reviewing a new safety protocol. The slide deck says outcomes improved. The budget team wants to know whether the improvement is large enough to justify staffing, training, and audit costs. ARR helps answer that question with a calculation simple enough to do on a whiteboard.
The math is easy. The judgment comes earlier, when you decide exactly what event to count, which groups to compare, and over what period.
Step 1. Define the event precisely
Start with one outcome and define it in operational terms.
That outcome might be a hospital-acquired infection, a readmission, a fall with injury, a medication error, or a device malfunction. The key is consistency. If one team counts "suspected infection" and the other counts only lab-confirmed infection, the final ARR will look precise but will not be trustworthy.
Residents often focus on the formula first. Administrators often focus on the decision first. Both need the same foundation: one event definition applied the same way to both groups.
Step 2. Identify the comparison groups
ARR compares two risks, so you need two clearly labeled groups:
- Control group
The baseline condition, such as standard care, the old protocol, or no intervention. - Experimental group
The group exposed to the new treatment, workflow, policy, or control measure.
This step matters more than it seems. If the groups are drawn from different populations, settings, or time periods without adjustment, the subtraction may reflect case mix or workflow differences rather than the intervention itself.
Step 3. Calculate the event rate in each group
Now convert counts into risks.
For instance, if a certain number of patients out of 100 in the control group had the event, that defines the control event rate. Similarly, if a different, lower number of patients out of 100 in the intervention group had the event, that defines the experimental event rate.
These rates are often abbreviated as CER and EER. You do not need the abbreviations to do the work correctly, but you do need the discipline to calculate both rates from the same denominator logic.
Step 4. Subtract in the correct order
Use the standard formula:
ARR = CER – EER
Using the event rates calculated, the ARR is the difference between the control event rate and the experimental event rate.
Write it in that order every time. Control minus experimental.
That habit prevents a common sign error. A positive ARR means the intervention lowered risk. A negative result means the intervention was associated with more events, which should trigger a closer clinical and operational review rather than a celebratory rollout.
Step 5. Translate the number into decisions people can use
An ARR should never stay trapped in spreadsheet language.
Say what it means: a certain number of fewer patients per 100 experienced the event after the intervention. That wording is what helps a chief nursing officer, a service line director, or a quality committee decide whether the gain is meaningful in practice.
ARR works like the difference between two water levels in the same tank. Relative measures describe the proportion of change. ARR shows the actual drop. For staffing plans, implementation priorities, and regulated reporting, the actual drop is usually the first number leaders need.
A related concept often causes confusion in vaccine studies and prevention programs. If your team is also reviewing reports framed around vaccine efficacy, keep asking the same grounding question: how many events were prevented in the population you serve?
A quick accuracy check before you report ARR
Before presenting ARR to a clinical council or executive team, confirm five things:
- The event is defined the same way in both groups
- The groups are reasonably comparable
- The timeframe is stated clearly
- The rates are based on actual counts, not vague claims of improvement
- The result is translated into plain language
That last point matters in regulated environments. Compliance, privacy, and risk teams often compare a baseline process with a new control process in the same way clinicians compare usual care with a new treatment. For example, if an organization is evaluating secure disposal controls through a certified data destruction service in Atlanta, the useful question is not whether the vendor promises a strong percentage improvement. The useful question is how much the event risk changed after the new control was put in place.
That is ARR in practice. Define the event, calculate both risks, subtract carefully, then convert the result into operational impact.
ARR vs Relative Risk Reduction and Odds Ratios
A hospital committee reviews a new safety protocol. The slide deck highlights a 40% reduction in adverse events. That sounds persuasive. The decision, however, depends on a more practical question. How many events were prevented in the population you serve?
ARR tells you the direct difference
Absolute risk reduction is the straight gap between two event rates. It answers the bedside and boardroom question first: what changed in absolute terms?
Using a previous example, where the event rate declined from one level to another, the ARR represents the direct difference. From these numbers, a relative risk reduction can also be calculated, which will appear as a larger percentage. Both statements are mathematically correct, but they create very different impressions.
That difference in framing matters in regulated organizations. A clinical leader deciding on a protocol, a quality officer reviewing a harm-reduction program, and an administrator weighing budget against benefit all need the number that reflects event avoidance, not just the size of the percentage headline.
RRR tells you the proportional drop
Relative risk reduction describes how much lower the treated risk is compared with the control risk.
A simple analogy helps here. ARR works like counting the dollars saved on a contract. RRR works like the percentage discount on the sales sheet. The percentage may sound impressive, but budget planning still depends on the amount saved.
That is why RRR can mislead decision-makers when baseline risk is low. A large relative drop can come from a small absolute change. If a report gives only the relative figure, ask for the underlying event rates before approving a policy, contract, or care pathway.
This confusion shows up often in public health communication. Readers comparing headlines about vaccine efficacy can easily miss the difference between a proportional effect and the number of cases prevented in a defined population.
Odds ratios answer a different question
Odds ratios belong to a different statistical toolset. They compare odds, not risks.
That distinction sounds minor until someone presents an odds ratio in an executive summary and the audience hears it as a risk reduction figure. Clinicians may sort out the difference quickly. Administrators, compliance officers, and board members often need it translated into plain language because operational decisions are usually made in terms of expected events, staffing impact, and cost.
Odds ratios are useful in some study designs, especially when direct risk estimates are less straightforward. They are just less intuitive for routine clinical communication.
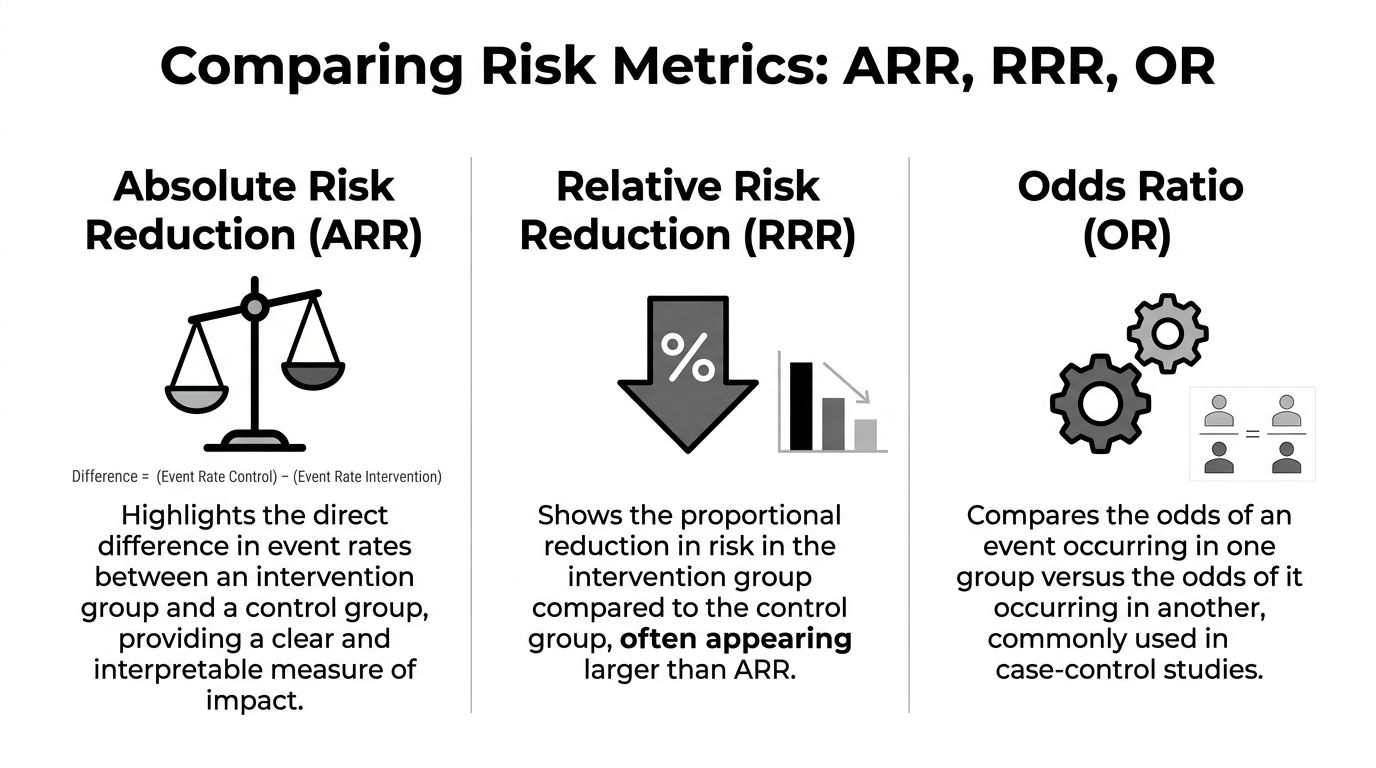
ARR vs RRR vs OR at a Glance
| Metric | What It Measures | Why it matters in practice |
|---|---|---|
| ARR | The direct difference in event rates between control and intervention groups | Best for estimating clinical or operational impact |
| RRR | The proportional reduction in risk relative to the control group | Helpful for comparison, but it can overstate practical importance |
| OR | The ratio of odds between groups | Common in research analysis, but easy to misread outside technical settings |
When each metric helps most
Use ARR when the decision is operational.
- How many patients or cases benefit
- Whether the gain is large enough to justify a policy change
- Whether expected benefit supports the cost, staffing, or compliance burden
Use RRR when comparing effect size across interventions or studies.
Use odds ratios when you are reading the statistical analysis closely and understand the study design behind the estimate.
The same habit applies outside direct patient care. A security or compliance team reviewing certified data destruction services in Atlanta should ask the same question a clinical committee asks about a treatment. How much did the event risk change after the control was introduced?
That question keeps strategy grounded. ARR is often the clearest safeguard against impressive wording and weak practical benefit.
Translating ARR into Number Needed to Treat
Absolute risk reduction becomes even more useful when you convert it into Number Needed to Treat, or NNT.
This is the point where statistics turn into planning.

What NNT means
NNT tells you how many patients must receive an intervention for one person to avoid the bad outcome.
The formula is:
NNT = 1 / ARR
Use ARR as a decimal when doing the calculation.
Why clinicians and administrators like NNT
An ARR can still feel abstract to some readers. NNT lands more quickly.
If a treatment has a particular ARR, the NNT is its inverse, indicating how many patients need treatment to prevent one bad outcome. That is exactly how the pediatric example is described in the NCBI material summarized earlier.
For example, in an anesthesiology setting, if chronic postsurgical pain is reduced from a higher rate to a lower rate, this produces a specific ARR and a corresponding NNT, as described in the NCBI overview already referenced earlier in the article.
How NNT changes the conversation
NNT helps different stakeholders ask better questions.
A clinician may ask whether treating that many patients is reasonable given the side effects.
A pharmacy and therapeutics committee may ask whether the avoided events justify formulary placement.
An administrator may ask whether staffing, training, and purchasing are worth it for that level of return.
A practical way to use it
When you review a study or proposal, write out both statements:
- ARR statement: How many events are prevented per 100 patients?
- NNT statement: How many patients must be treated to prevent one event?
Those two sentences often do more for decision-making than a full page of dense statistics.
Practical tip: NNT is only as meaningful as the population and timeframe behind it. Always pair it with who was studied and over what period.
That habit prevents one of the most common interpretation errors. People lift an NNT from a study and apply it to a different patient mix or care setting. The math may still be correct, but the decision may not be.
Why ARR and NNT Matter for Hospital Leaders
Hospital leaders do not make decisions in a vacuum. They choose between competing priorities, limited budgets, implementation burdens, and scrutiny from clinicians, regulators, and finance teams.
That is exactly why absolute risk reduction and number needed to treat matter. They move the conversation from enthusiasm to judgment.
Evaluating therapies and technologies
A new drug, device, or protocol can look impressive when the summary emphasizes relative change. ARR and NNT force a more grounded review.
The SPRINT trial is a good example. Intensive blood pressure control produced an annual primary outcome rate of 1.65% versus 2.19% in the standard group, which yielded an ARR of 0.54% per year and an NNT of about 185 to prevent one cardiovascular event annually, as summarized in this discussion of the SPRINT trial and ARR.
A casual reader may focus on the 25% relative risk reduction. A hospital leader has to go further. If you need to treat about 185 patients for a year to prevent one event, the operational and financial implications look different than the relative figure alone might suggest.
Budgeting and resource allocation
ARR and NNT support more disciplined budgeting.
When a committee considers rollout, it has to estimate more than efficacy. It must weigh staffing, monitoring, adherence burden, training, workflow redesign, and possible harms. Absolute measures provide a better starting point for that exercise because they tie benefit to the number of prevented events.
A strong leader asks:
- How many patients in our system resemble the study population
- What is our baseline event rate
- What effort is required to reach the reported effect
- What are we giving up if we fund this instead of another initiative
These questions reflect the same basic discipline used in broader organizational risk reduction work. Leaders compare baseline exposure, post-intervention exposure, and the resources needed to achieve the change.
Communication with boards, clinicians, and patients
ARR and NNT also improve communication.
Boards need clarity, not inflated framing. Clinicians need evidence that maps to practice. Patients deserve counseling that reflects real benefit rather than promotional wording.
Consider how different these two statements feel:
- “This intervention reduces risk by a quarter.”
- “This intervention lowers the annual event rate by a small absolute amount, which means many patients need treatment for one event to be prevented each year.”
The second statement is not weaker; it is more honest and more useful.
Leadership principle: If your organization cannot explain benefit in absolute terms, it does not yet understand the intervention well enough to scale it confidently.
Why regulated organizations should care
In regulated environments, defensible decisions matter as much as ambitious ones.
ARR and NNT create a traceable logic for adoption decisions, policy updates, formulary choices, and quality initiatives. They show that leadership looked beyond headline claims and considered real-world impact. That is good clinical governance and good operational governance.
Common Pitfalls and Reporting Best Practices
Most errors with absolute risk reduction do not come from difficult math. They come from incomplete reporting and rushed interpretation.
Common pitfalls
- Reporting only relative effects: A large relative reduction can distract readers from a small absolute benefit.
- Ignoring baseline risk: The same treatment can look very different in a high-risk population versus a low-risk one.
- Leaving out the timeframe: Risk reduction without a stated period is hard to apply.
- Using NNT without context: An NNT from one study population may not transfer to your own patients.
- Confusing statistical significance with operational importance: A finding can be statistically persuasive and still have a modest practical effect.
Better reporting habits
A useful report does not force the audience to reverse-engineer the evidence.
Include these elements whenever possible:
- State the control and intervention event rates
Readers should see the underlying numbers, not just a derived summary. - Provide ARR and relative measures together
That allows a fairer reading of magnitude and proportion. - Name the population and setting
Applicability depends on who was studied. - Specify the study period
Risk reduction over a year means something different than risk reduction over a hospital stay. - Translate the statistic into plain language
Explain what the result means for actual patients or workflows.
Best practice: The most trustworthy reports show both the size of the effect and the conditions under which it was measured.
Why this matters in administration
Leaders in healthcare, IT, compliance, and sustainability all face a similar challenge. They must distinguish between a well-framed result and a decision-ready result.
That is why mature organizations build repeatable review processes. In business settings, this broader habit appears in governance frameworks for evidence review, vendor assessment, and business sustainability strategy. In clinical settings, ARR and NNT play the same role. They turn claims into something you can test, compare, and defend.
Frequently Asked Questions about Absolute Risk Reduction
Is a bigger ARR always better
Typically, a larger ARR means more direct benefit. But it is not the only factor. You need to consider harms, cost, feasibility, and whether the study population matches your own.
What does a negative ARR mean
A negative ARR means the intervention group had a higher event rate than the control group. In practical terms, the intervention may have increased harm rather than reduced it.
Is ARR better than relative risk reduction
For many clinical and operational decisions, ARR is more informative because it shows the actual difference in event rates. Relative risk reduction can still be useful, but it should not stand alone.
Why do some studies report odds ratios instead
Some study designs and statistical models use odds ratios because they fit the analysis method. That does not make them easier to interpret for frontline decisions. If you see an odds ratio, ask for the underlying event rates when possible.
Can I use an online calculator
Yes, but calculate it manually a few times first. That habit helps you spot reporting errors and understand what the calculator is doing.
Where does ARR fit in broader risk management thinking
It fits anywhere leaders compare baseline risk with post-intervention risk. The same mindset supports evidence review in clinical care, cybersecurity, compliance, and asset disposition governance, including practical frameworks for IT asset management best practices.
What should I ask when someone presents a risk reduction claim
Ask three things right away:
- What were the event rates in each group?
- What is the absolute risk reduction?
- Over what timeframe and in which population?
Those questions will improve the quality of every evidence discussion you have.
If your organization in the Atlanta metro area needs a practical partner for secure, compliant electronics recycling and end-of-life IT handling, Atlanta Green Recycling provides pickup, data destruction, and decommissioning support for hospitals, businesses, schools, and government teams. Their mission-driven model also supports veteran aid and tree planting, giving organizations a way to align responsible disposal with broader sustainability and community goals.