Relative Risk Reduction: A Guide to What It Really Means

A patient once told me, “My doctor said this pill cuts my risk in half, so I assumed I’d be foolish not to take it.” Then we looked at the actual numbers, and the decision became much less dramatic.
That gap between a striking headline and a grounded interpretation is where relative risk reduction helps and misleads at the same time.
The Headline That Hides the Truth
A health story breaks. The headline says a new treatment “cuts risk by 50%.” That wording is technically possible and still incomplete.

For readers, “50% reduction” sounds enormous. For clinicians, it should trigger a second question immediately: 50% of what starting risk?
Why headlines favor relative numbers
Relative figures are compact. They fit in a headline, a press release, or a television sound bite. They also sound bigger than absolute figures.
Take a simple example. If risk falls from 2 in 1,000 to 1 in 1,000, the relative change is large. The absolute change is small. Both statements describe the same result, but they leave very different impressions.
That’s where many people get lost. They assume a large relative risk reduction must mean a large real-world benefit. Sometimes it does. Sometimes it doesn’t.
Ask one question before reacting to any risk claim: What was the baseline risk in the first place?
Why this matters beyond individual patients
This isn’t just a patient education issue. Journalists shape public understanding. Policymakers allocate resources. Health systems decide which interventions deserve attention, budget, and rollout.
If they rely on relative risk reduction alone, they can overstate benefit in low-risk settings and underappreciate interventions with modest relative effects but substantial absolute impact.
A good interpreter of medical evidence does something common. They resist the headline. Then they reconstruct the story from the underlying risks.
What Is Relative Risk Reduction
A clinician reads a trial and sees that a drug cut the risk of an event by a notable percentage. A journalist sees the same number and reaches for the headline. Both are looking at a real result, but the number itself answers only one question: how much lower was risk compared with where it started?
That is what relative risk reduction measures. It expresses the drop in risk as a proportion of the risk in the control group. In plain terms, it is the percentage decrease from the starting risk, not the final chance of the outcome and not the number of people who benefit.
A sale discount works the same way. “50% off” tells you the size of the reduction relative to the original price. It does not tell you what the item costs until you know the starting price.
The formula
The standard formula is:
RRR = (CER − EER) / CER
Where:
- CER is the control event rate
- EER is the experimental event rate
A concise summary of the formula appears in the relative risk reduction reference.
A step-by-step example
Suppose the event rate is 12 per 100 in the control group and 4 per 100 in the treatment group.
Now work through it:
Find the absolute difference in risk
12 per 100 minus 4 per 100 equals 8 per 100.Scale that difference to the control risk
8 divided by 12 equals about 0.67.Convert it to a percentage
0.67 becomes 67%.
So the treatment’s relative risk reduction is 67%.
Pause on what that means, because readers often go wrong at this point. A 67% RRR means the treated group had about two-thirds less risk than the control group, relative to the control group’s starting risk. It does not mean 67 out of 100 patients avoided harm because of treatment.
That distinction sits at the heart of evidence-based medicine. The metric is describing a proportion, not a body count.
Why researchers use RRR
Researchers often report RRR because it captures the proportional effect of an intervention in a compact way. If one setting has risk reduced from 20% to 10% and another from 4% to 2%, the relative reduction is the same in both cases. That can help when comparing whether an intervention appears to have a similar effect across different populations.
But “same relative effect” does not mean “same practical benefit.” That is the communication problem. Relative measures travel well in abstracts, press releases, and policy briefs, yet they are easy to overread if the starting risk is left unstated.
For a paired explanation of the metric that shows the actual size of the difference in risk, see this guide to absolute risk reduction.
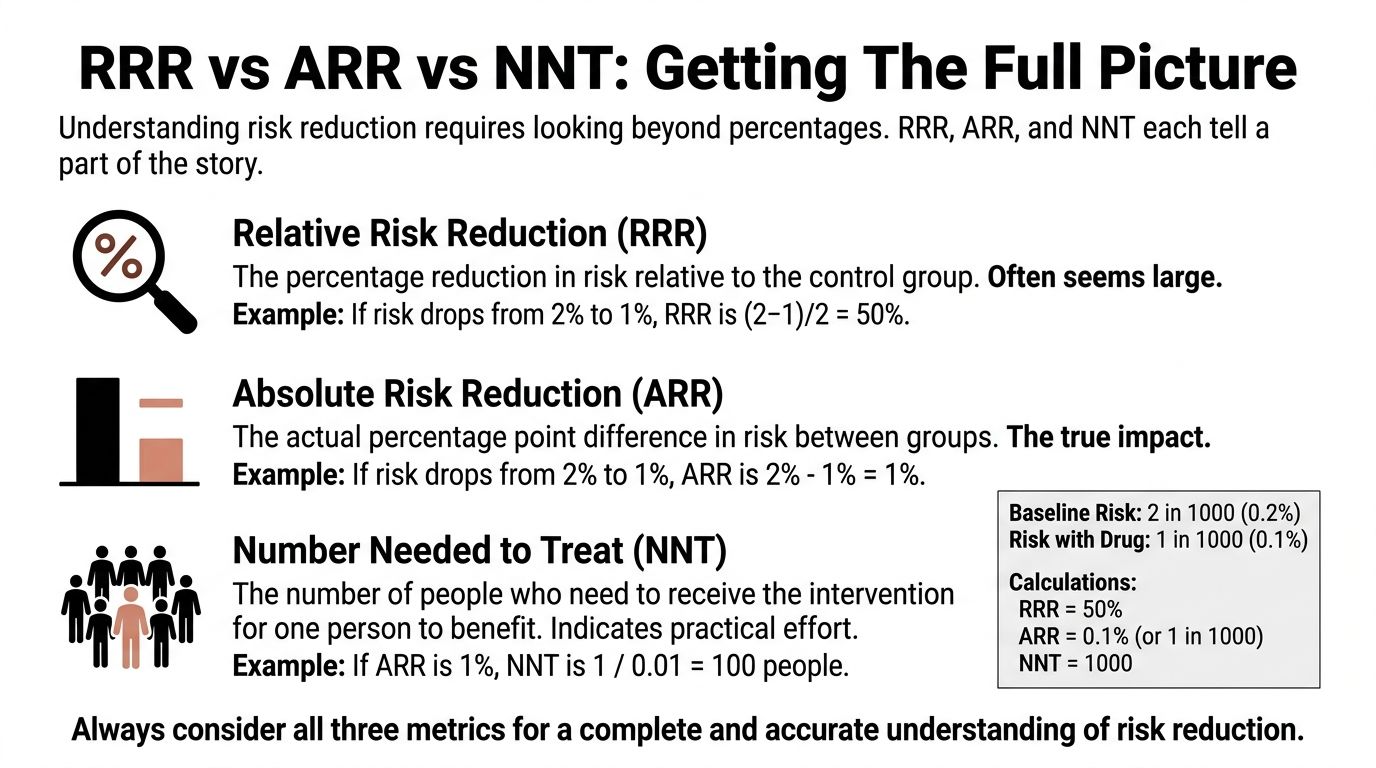
RRR vs ARR and NNT Getting The Full Picture
A single metric rarely tells the full clinical story. Relative risk reduction tells you the proportional drop. Absolute risk reduction tells you the actual difference in event rates. Number needed to treat tells you how many people must receive the intervention for one person to benefit.
That three-part view is much closer to how clinicians practice and how careful reporting should work.
Start with the clearest contrast
The clearest contrast comes from workplace injury examples discussed by the Institute for Work & Health in its explanation of absolute and relative risk.
Two interventions can both show 50% RRR:
- One reduces injury risk from 2 per 100 to 1 per 100
- Another reduces injury risk from 50 per 100 to 25 per 100
The relative effect is identical. The absolute impact is not. In the first case, 1 fewer worker per 100 is injured. In the second, 25 fewer workers per 100 are injured.
That’s why RRR alone can distort judgment.
What ARR adds
Absolute risk reduction (ARR) is the difference between the two risks.
If risk falls from 12 per 100 to 4 per 100, the ARR is 8 per 100. That tells you how many fewer events occurred in the treated group.
Clinicians often find ARR more intuitive for patient discussion because it answers a practical question: how much did the event rate change?
What NNT adds
Number needed to treat (NNT) converts ARR into effort.
You calculate it as:
NNT = 1 / ARR
When ARR is expressed as a proportion, NNT tells you how many patients need treatment for one patient to benefit. If ARR is small, NNT gets large. If ARR is larger, NNT gets smaller.
That’s one reason NNT often changes dramatically across populations even when the relative risk reduction stays the same.
Comparing the metrics side by side
| Metric | What It Asks | Calculation | Example Result | Interpretation |
|---|---|---|---|---|
| Relative Risk Reduction | How much lower is risk relative to the control group? | (CER − EER) / CER | 67% | Strong proportional effect |
| Absolute Risk Reduction | How many fewer events occurred? | CER − EER | 8 per 100 | Direct change in event rate |
| Number Needed to Treat | How many people must be treated for one to benefit? | 1 / ARR | Depends on ARR format | Practical effort required |
A quick clinical rule
Practical rule: Never quote relative risk reduction to patients without also giving the absolute difference in risk.
That habit sits at the center of good evidence-based medicine, because treatment decisions depend on both efficacy and context.
If you want a calculator-style explanation of the arithmetic, this internal guide to the absolute risk reduction formula helps connect the numbers.
Reading Between the Lines Statistical Uncertainty
A published relative risk reduction isn’t a permanent fact. It’s an estimate from a sample.
That means two questions always follow. How precise is the estimate? And how likely is it that random variation explains the result?
Confidence intervals in plain language
A confidence interval gives a range of plausible values for the true effect.
If a study reports a treatment effect with a narrow interval, the estimate is more precise. If the interval is wide, the estimate is less stable. The point estimate may look impressive, but the surrounding uncertainty may be substantial.
For clinicians, that matters because treatment recommendations shouldn’t rest on the single bold number in an abstract. For journalists, it matters because headline writing often strips away the uncertainty that gives the result its meaning.
What to look for when reading a trial
Use this checklist:
- Check the interval width: A narrow interval suggests more precision. A wide one should make you cautious.
- Check whether the interval includes very small effects: If it does, the intervention may be less clinically useful than the headline implies.
- Check consistency with absolute outcomes: A relative effect with shaky precision can look more substantial than it is if you never inspect the event rates.
Where p-values fit
A p-value addresses whether the observed result is compatible with chance under a specific null hypothesis. It doesn’t tell you the size of the effect, whether the effect matters clinically, or whether the estimate is precise enough for action.
That’s where many readers go wrong. They see “statistically significant” and assume “important.” Those are not the same thing.
A statistically detectable effect can still be clinically trivial. A clinically meaningful effect can still be estimated imprecisely.
For a plain-language companion on absolute measures, this guide on absolute risk reduction helps anchor the discussion in outcomes patients can grasp.
Common Misinterpretations and How to Spot Them
The most common mistake is treating relative risk reduction as if it directly describes personal benefit. It doesn’t. It describes proportional change.
That error grows in low-risk settings, where a dramatic percentage can sit on top of a tiny baseline.

The iceberg problem
Think of RRR as the visible tip of an iceberg. The hidden mass below the water is the baseline risk.
If you only look at the tip, the treatment appears huge. Once you account for the baseline, the practical effect may look very different.
A classic public example came from vaccine reporting. The National Center for Biotechnology Information discussion noted that Pfizer’s trial showed 95% relative risk reduction, while the absolute risk reduction was 0.84% and the number needed to treat was around 119 in the general population during the trial period, as summarized in this NCBI resource.
Those figures describe the same trial. They produce very different public impressions.
Questions that uncover distortion
When you read or hear a large relative claim, ask:
- What was the event rate without treatment?
- What did the risk fall to with treatment?
- What is the absolute difference?
- How many people need the intervention for one person to benefit?
If those answers are missing, the communication is incomplete.
Why this matters outside medicine too
This is the same reasoning analysts use when they go beyond vanity metrics to prove real value. A large percentage can look persuasive while hiding a modest underlying effect. Health communication has the same problem, but the consequences are more significant.
A second common error
People also compare relative risk reductions across different demographic groups and assume equal benefit. That can be wrong.
A treatment may have a consistent proportional effect while producing very different practical value because baseline risks differ by age, comorbidity, or exposure. That’s why clinicians shouldn’t stop at “this drug cuts risk by half.” They need to ask, “What does half mean for this patient?”
If you want a plain-language framing of that issue, this explanation of absolute risk reduction meaning complements the interpretation.
When to Use Relative Risk Reduction Effectively
A good clinician and a good reporter often ask different first questions.
The clinician asks, "What will this do for the patient in front of me?" The reporter may ask, "How strong is the treatment effect?" Relative risk reduction is better suited to the second question than the first. It describes the proportional effect of an intervention, which makes it useful for comparing how consistently that intervention performs across groups with different starting risks.
Here is a simple way to see it. If a treatment reduces risk from 20% to 10% in one group, and from 4% to 2% in another, the relative risk reduction is 50% in both groups. The absolute benefit is very different, but the proportional effect is the same. For example, in that hypothetical scenario, the NNT would be 10 in the higher-risk group and 50 in the lower-risk group. The discussion of relative and absolute risk reduction explains why those measures can move in different directions while describing the same underlying result.
That pattern matters because RRR works like a zoomed-out map. It helps researchers see whether an intervention has a fairly stable effect across settings, even when the practical payoff changes from one population to another.
RRR is especially useful for:
- Comparing trial results: It helps researchers examine whether the proportional treatment effect looks similar across studies or subgroups.
- Interpreting mechanism: A fairly stable relative effect can fit with the idea that the intervention acts through the same biologic pathway in different patients.
- Building models: Health economists and policy analysts often begin with a proportional effect estimate, then apply it to populations with different baseline risks.
That is a very different job from choosing care for one patient or writing a public-facing headline.
In those settings, RRR should sit beside other measures, not replace them. A bedside decision needs the patient's baseline risk. A formulary decision needs the expected absolute benefit across the covered population. A news story needs enough context that readers do not mistake a large percentage for a large real-world gain.
A practical rule helps. Use RRR to compare proportional efficacy. Use ARR to judge the size of the benefit. Use NNT to judge how much effort, treatment exposure, or cost is required for one person to benefit.
Clinicians, journalists, and policymakers all need that full frame, because the same relative effect can mean something very different in a high-risk population than in a low-risk one. This broader guide to risk reduction metrics and interpretation is useful if you want to place RRR inside that larger decision framework.
How to Communicate Risk Reduction Responsibly
A patient hears, "This drug cuts risk by 50%," and pictures a large personal benefit. The clinician may mean the statement accurately. The listener may still leave with the wrong impression.
That gap is the central problem in risk communication. Relative risk reduction describes a proportion. Patients, readers, and policymakers usually need a change in real-world odds. Responsible communication closes that gap by translating the proportion into numbers that fit the person or population in front of you.
A direct way to say it is: "Your starting risk matters. This treatment lowers that risk by a certain proportion, and in absolute terms the change is this much." Shared decision-making depends on that second number.

A weather forecast offers a useful analogy. Saying the chance of rain fell by 50% sounds dramatic. Cutting the chance from 40% to 20% changes your plans more than cutting it from 2% to 1%. The relative change is the same. The practical consequence is not.
A short checklist for responsible reporting
- For clinicians: Start with the patient's baseline risk. Then give the relative effect. Then state the absolute change and, when relevant, the likely trade-offs such as adverse effects, cost, or treatment burden.
- For journalists: Do not report a percentage reduction alone. Include the event rates in both groups so readers can see whether the benefit is large, modest, or tiny in absolute terms.
- For policymakers: Compare interventions by expected absolute benefit in the target population, not by relative effect alone. Resource allocation depends on how many events are prevented.
A simple script that works
“This treatment reduces risk relative to where you start. For someone with your baseline risk, the absolute benefit is about this much, so the decision depends on whether that benefit is large enough to justify the downsides.”
That phrasing does two jobs at once. It keeps the statistics honest, and it helps the listener judge whether the result is meaningful rather than merely impressive.
If your Atlanta organization is clearing out retired laptops, servers, drives, or office electronics, Atlanta Green Recycling offers secure, compliance-minded e-waste disposal with pickup across the metro area. Their team supports IT departments, hospitals, schools, government agencies, and data centers with responsible recycling, data destruction, and end-of-life asset handling. For companies that want sustainability efforts to mean something locally, their mission-driven model also connects recycling with veteran support and tree planting.