What Is Absolute Risk Reduction? A Practical Guide

Most hospital leaders have seen the same slide deck problem. One intervention is presented with a dramatic percentage. Another is described with a smaller number that sounds less impressive. Both may be accurate. Only one may help you decide what to fund, what to standardize, and what to explain to patients.
That is where absolute risk reduction matters.
If you manage budgets, evaluate protocols, or approve technology purchases, you already think in absolute terms all day. You do not ask only whether a recycling program reduced waste “by a large share.” You ask how much material stayed out of the landfill. You do not approve a security upgrade for its sound alone. You ask how many incidents it is likely to prevent. The same discipline applies in clinical decision-making.
When people search for what is absolute risk reduction, they are usually trying to solve a practical problem, not a math problem. They want to know what a treatment changes in the world.
Navigating a Sea of Confusing Statistics
A hospital administrator comparing two interventions often gets numbers that are technically correct but operationally unhelpful.
One team says a therapy cuts risk by half. Another says its protocol prevents a handful of events per hundred patients. The first statement sounds bigger. The second statement is often more useful.
That gap matters because hospitals do not run on headlines. They run on staffing, formularies, patient communication, quality metrics, and budget tradeoffs. If the metric exaggerates practical benefit, leaders can overinvest in the wrong program or oversell the likely outcome to patients and clinicians.
Why headline percentages create confusion
Relative numbers are persuasive because they sound dramatic. Absolute numbers are persuasive because they describe what changes on the ground.
A sustainability leader faces the same issue. Saying a program improved waste performance sounds good, but saying how much waste was diverted is what supports planning, audits, and ROI discussions. That same kind of operational clarity shows up in healthcare when people move from flashy percentages to event rates and prevented harms. The logic is similar to how organizations assess the benefits of e-waste recycling by looking at concrete outcomes rather than broad claims.
The metric administrators need
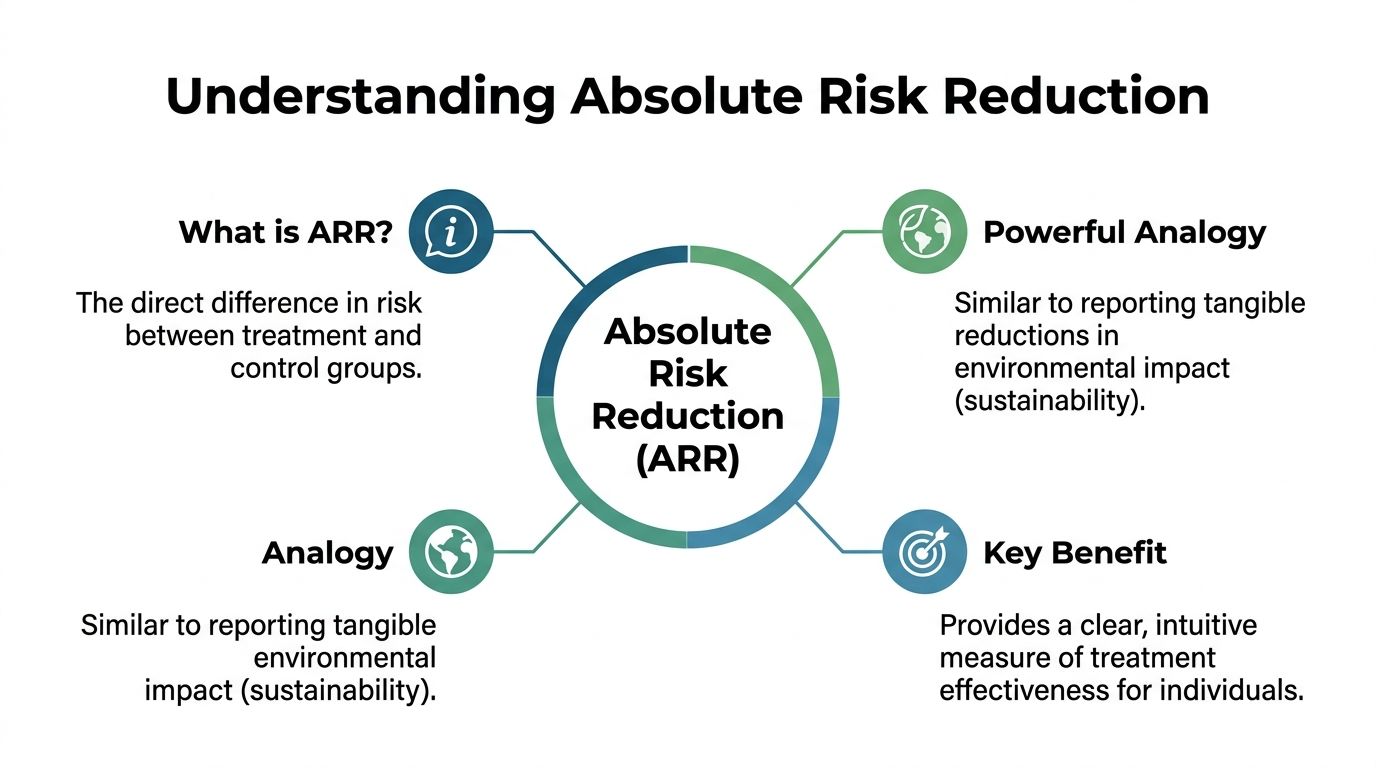
Absolute Risk Reduction, or ARR, tells you the actual difference in bad outcomes between a control group and a treatment group.
That makes it useful when you need to answer questions like these:
- Formulary question: How many adverse events will this drug prevent in our patient population?
- Quality question: Will this protocol materially reduce complications, or just sound impressive in committee?
- Patient communication question: Can we explain expected benefit in a way that a non-statistician can understand?
Key takeaway: ARR is not about sounding large. It is about showing the size of the change in practice.
When administrators use ARR, discussions get sharper. People stop arguing over marketing language and start asking better questions about baseline risk, implementation effort, and expected benefit.
Defining Absolute Risk Reduction Clearly
The clearest way to understand what is absolute risk reduction is to compare it to how a business reports operational improvement.
If a company says it reduced waste by a large share, that is interesting. If it says it kept a specific amount of waste out of the landfill, that is actionable. One tells you the improvement sounds meaningful. The other tells you what changed in practice.
The plain-English definition
Absolute risk reduction is the arithmetic difference between the event rate in the control group and the event rate in the treatment group. A clear example appears in this explanation of calculating absolute risk reduction, which shows that if a vaccine lowers disease incidence from 5% in the control group to 1% in the treated group, the ARR is 4 percentage points.
That means the intervention prevented 4 events per 100 people treated.
Not “it worked well.” Not “risk was much lower.” A direct difference.
The formula
The formula is simple:
ARR = CER – EER
Where:
- CER means Control Event Rate
- EER means Experimental Event Rate
What those two parts mean
A quick way to remember them:
| Term | Meaning | Simple question |
|---|---|---|
| CER | Event rate in the control group | What happened without the intervention? |
| EER | Event rate in the treatment group | What happened with the intervention? |
Subtract the second from the first.
That subtraction gives you the actual drop in risk caused by the intervention.
Why this definition matters
ARR keeps the discussion anchored to patients, not promotion.
For a hospital leader, this is the metric that answers practical questions:
- How many complications are we likely to prevent?
- Is the effect large enough to justify training, workflow changes, or added cost?
- Does this benefit remain meaningful in our own population?
A relative measure can make a small change sound dramatic. ARR tells you the size of the change in terms people can use.
Think of ARR like reporting actual waste diverted instead of just a percent improvement. The absolute figure is what supports planning, accountability, and decision-making.
A Worked Example Calculating ARR
The easiest way to make ARR stick is to calculate it once from start to finish.
This example comes from a pediatric fever and rash study. It is simple, concrete, and useful because it translates neatly into plain language.

Start with the two event rates
In the study, the control event rate was 20% and the experimental event rate was 12%, as summarized in this review of what absolute risk reduction is and how it is used.
Put that into a simple table:
| Group | Bad outcome rate |
|---|---|
| Control group | 20% |
| Treatment group | 12% |
Apply the formula
Use the formula:
ARR = CER – EER
So:
ARR = 20% – 12% = 8%
That is the calculation.
Translate the result into normal language
Many teams stop too early at this point. They report the 8% and move on.
A better interpretation is:
For every 100 children treated, 8 avoid the bad outcome because of the intervention.
That sentence is why ARR matters. It converts an abstract statistic into a practical effect size.
If you are a hospital administrator, this is the difference between a metric you can repeat in a committee meeting and a metric that gets lost in a technical appendix.
Why this feels more useful than many trial summaries
ARR behaves like an operations metric.
When an IT team plans a migration, they do not just ask whether the new environment is “more reliable.” They want to know what failure reduction means in practice, how many disruptions are avoided, and what implementation effort is justified. That same mindset shows up in disciplined planning for data center migration best practices, where concrete operational outcomes matter more than broad claims.
One more practical interpretation
If your infection prevention committee, pharmacy committee, or quality committee is reviewing a proposal, ARR lets you ask:
- What is the actual difference in outcomes?
- How many people benefit per hundred treated?
- Is that impact meaningful enough to justify adoption?
Tip: When someone presents ARR, ask them to finish the sentence “Out of 100 patients, how many benefit?” If they cannot answer clearly, the metric has not yet been translated into decision-ready language.
That habit alone improves meeting quality. It forces teams to present evidence in a form that supports staffing decisions, patient counseling, and budget planning.
ARR vs Relative Risk Reduction The Critical Difference
The biggest confusion around ARR comes from a close cousin, Relative Risk Reduction, or RRR.
Both metrics describe change. They do not describe it the same way.
ARR tells you the difference in event rates. RRR tells you the proportion by which risk fell relative to the control group. That makes RRR sound larger in many cases.
A side-by-side look
Using the same pediatric example:
- Control event rate = 20%
- Treatment event rate = 12%
- ARR = 8%
To get RRR, you divide the reduction by the control rate. In this case, the drop from 20% to 12% is 8 points out of 20, so the relative reduction is larger than the absolute one.
That does not make RRR wrong. It makes it easier to overread.
ARR vs RRR at a Glance
| Attribute | Absolute Risk Reduction (ARR) | Relative Risk Reduction (RRR) |
|---|---|---|
| What it measures | The direct difference in event rates | The proportional reduction relative to baseline |
| Best use | Real-world decision-making | Comparative framing |
| How it sounds | Usually more modest | Often more dramatic |
| Main weakness | Can sound small without context | Can exaggerate practical impact |
| Question it answers | How many fewer events occur? | By what proportion did risk drop? |
Why RRR can mislead smart people
This confusion is common, not rare. Surveys indicate that 70-80% of physicians and consumers overestimate benefits when presented only with RRR, and the same source notes that a treatment with 50% RRR might have only 2% ARR in a low-risk population.
That is the core issue. A large relative improvement can still correspond to a small absolute change.
A business analogy that lands quickly
Suppose a facility reduces a low-volume waste stream by half. That sounds strong. But if the actual quantity was small to begin with, the operational impact may be modest.
Now compare that with a smaller-sounding proportional reduction in a very large waste stream. The second change may save more labor, more disposal cost, and more landfill space.
Healthcare works the same way. Baseline risk changes the meaning of improvement.
What administrators should ask when they hear RRR
When a vendor, clinician, or researcher presents a large relative reduction, pause and ask:
- What was the baseline risk?
- What is the ARR?
- How many actual events are prevented?
- Does that benefit justify the cost, training, and workflow disruption?
Those questions tend to separate clinically meaningful changes from persuasive framing.
Key takeaway: RRR is useful for description. ARR is better for action.
If you remember one thing, remember this: a dramatic percentage can still represent a small real-world benefit.
From ARR to Number Needed to Treat
Once you understand ARR, the next metric becomes much easier to use.
That metric is Number Needed to Treat, or NNT.
NNT takes the impact described by ARR and reframes it as effort. Instead of asking how much risk drops, it asks how many people must receive the intervention to prevent one bad outcome.
The formula
The relationship is direct:
NNT = 1 / ARR
ARR must be expressed as a decimal for this calculation.
A non-clinical example that makes NNT intuitive
A workplace safety example shows the concept well. In a factory safety program, the injury rate dropped from 30 per 100 to 12 per 100, producing an ARR of 18%. That translates to an NNT of about 6, meaning the intervention had to be applied to 6 workers to prevent one injury, as explained in this discussion of absolute and relative risk in occupational health.
For administrators, that framing is powerful because it ties outcome to resource use.
Why NNT works so well in leadership settings
NNT often lands faster than ARR in committee rooms because it sounds like an efficiency metric.
It answers:
- How much work does success require?
- How broadly do we need to deploy this intervention to prevent one event?
- Is that level of effort reasonable in our setting?
The operational analogy
Think of NNT as the “cost of success” in unit terms.
A sustainability team may ask how many pickup cycles, devices processed, or staff hours are required to prevent one unit of waste from ending up in landfill. Clinical teams ask the same kind of question through NNT. The intervention may still be worth it with a higher NNT, but leaders can at least see the scale of effort clearly.
How to use NNT responsibly
NNT should not replace judgment. It should sharpen it.
A lower NNT often signals a more efficient intervention. But context still matters. Side effects, implementation burden, patient preferences, and strategic priorities all belong in the conversation.
Practical rule: ARR tells you the size of benefit. NNT tells you the effort required to achieve it.
Used together, they make a trial result far easier to evaluate than RRR alone.
When to Use ARR in Your Organization
ARR belongs in more meetings than it usually appears in.
If your organization makes clinical, financial, or operational decisions based on evidence, ARR helps keep those decisions grounded in actual benefit.
Formulary and value analysis decisions
A formulary committee should not approve a therapy based only on a large relative reduction.
ARR forces a better discussion. What is the actual drop in adverse outcomes? Is the benefit likely to matter in the population your hospital serves? Does the size of the effect justify acquisition cost, monitoring burden, and staff training?
Patient communication and shared decisions
Patients rarely think in relative percentages. They want plain language.
ARR supports clear counseling because clinicians can explain benefit as the actual difference in outcomes between treatment and no treatment. That makes the tradeoff easier to understand, especially when risks, side effects, and follow-up demands need to be weighed carefully.
Quality improvement and safety programs
Hospital leaders also use ARR when judging whether a new workflow is worth standardizing.
That could involve medication safety, discharge follow-up, infection prevention, or device-related complications. In each case, ARR shifts the conversation from “this seems effective” to “this prevents a meaningful number of bad outcomes.”
The same logic appears in broader operational planning around risk reduction, where leaders need to know whether a mitigation step changes exposure in a way that justifies execution.
Why regulators care too
This is not just a preference of evidence-minded administrators. Regulatory bodies like the FDA and EMA mandate reporting ARR alongside RRR in clinical trials to reduce misinterpretation and support policy and clinical decision-making, including derivation of NNT.
That matters because it confirms a basic principle. Decision-makers need more than a dramatic framing of benefit. They need a transparent description of actual effect.
A simple internal standard
Many organizations improve evidence review by asking teams to present these items together:
- Baseline risk in the control group
- Absolute risk reduction
- Number needed to treat
- Operational burden of implementation
That format produces better discussion than a single headline percentage ever will.
Common Pitfalls and How to Interpret ARR Correctly
ARR is useful, but it is not self-explanatory in every setting.
A good interpreter asks whether the number is reliable, whether the population matches local reality, and whether the underlying data quality is strong enough to support the conclusion.
Do not ignore uncertainty
An ARR estimate should be interpreted alongside its confidence interval when that information is available. If an interval excludes zero, it suggests statistical significance. However, if the interval includes zero, the data may not support a confident claim of benefit.
Baseline risk changes meaning
ARR always depends on where the group started.
A treatment can have the same relative effect in two populations and still produce a very different absolute benefit. That is why local population characteristics matter. A protocol that looks compelling in a high-risk cohort may have a smaller practical payoff in a lower-risk hospital population.
Bad inputs produce bad ARR
ARR looks simple because the subtraction is simple. The hard part is making sure the event rates are trustworthy.
If your organization struggles with inconsistent coding, incomplete follow-up, or mismatched numerator and denominator definitions, the ARR will be shaky no matter how polished the presentation looks. Teams working on managing data quality often find that small data discipline issues can distort downstream metrics in ways leadership notices only after decisions are already made.
The same lesson applies outside clinical analytics. In secure disposition programs such as IT asset disposal, weak inventory control or incomplete chain-of-custody records can undermine confidence in the final reporting, even when the process itself appears straightforward.
Three checks before trusting ARR
- Check population fit: Make sure the study group resembles your patient population.
- Check event definitions: Confirm that the bad outcome was measured consistently across groups.
- Check data completeness: Missing or messy data can make a precise-looking ARR less dependable than it appears.
Tip: Treat ARR as decision support, not a standalone verdict. It becomes powerful when paired with context, data quality, and clinical judgment.
Making Smarter Decisions with Absolute Metrics
Absolute metrics improve judgment because they tie evidence to practical effect.
That is how to understand what is absolute risk reduction. It is a way to express treatment benefit in terms that support decisions, budgets, workflows, and patient conversations. ARR tells you how many outcomes changed. NNT tells you how much effort success requires. Together, they make evidence harder to oversell and easier to use.
Hospital leaders already trust this style of thinking in operations. They want concrete reductions in waste, incidents, delays, and exposure. Clinical evaluation should work the same way. Absolute measures create a cleaner line between evidence and action.
That same preference for tangible outcomes shapes responsible planning in other domains, including business sustainability strategy, where leaders need measurable impact rather than broad claims.
Use ARR when the decision matters. In healthcare, it almost always does.
If your organization in the Atlanta area is applying the same disciplined thinking to end-of-life technology, Atlanta Green Recycling helps hospitals, businesses, schools, and public agencies manage electronics recycling, secure data destruction, and IT asset disposition with a focus on measurable operational results. Their mission-driven approach also supports veteran aid and tree planting, giving teams a practical way to connect responsible disposal with broader community impact.