The Absolute Risk Reduction Formula: A Guide

You are probably reading a paper, a drug summary, or a hospital formulary note that says a treatment “reduced risk by” some impressive relative amount. That sounds decisive until you ask the question that matters at the bedside. How many patients benefit?
The absolute risk reduction formula earns its place by stripping away promotional framing and giving you the difference in event rates between people who did not receive an intervention and those who did. For clinicians, students, and administrators, that difference is often the most honest starting point for decision-making.
Why Absolute Risk Matters More Than You Think
A common clinical problem looks simple on the surface. One study reports a dramatic relative reduction. Another tells you how many fewer bad outcomes occurred per group. Those statements can describe the same data, but they do not feel the same.

At the bedside, patients usually do not ask for relative effects. They ask versions of two practical questions:
- What is my chance of the bad outcome without treatment?
- How much does treatment lower that chance in real terms?
Those are absolute questions. They depend on baseline risk.
Consequently, the same treatment can sound impressive in one abstract and modest in a clinical conversation. Relative measures are not useless, but they can make a small baseline risk look larger than it feels in practice. Absolute measures force you to confront the true difference.
Why students and clinicians get tripped up
The confusion usually starts when event rates are low. A proportional change can look large even when the arithmetic gap is small. If you do not anchor your reading in absolute terms, you can overestimate clinical impact.
That matters in cardiology, oncology, prevention, and public health. It also matters in personalized care, where baseline risk varies from patient to patient. If you want a good primer on how baseline risk is estimated in practice, this guide to understanding your cardiovascular risk score is useful context.
Clinical habit worth building: When you see a relative effect first, pause and ask for the event rates in both groups.
What absolute risk tells you
Absolute risk reduction does something very simple. It answers, “How many fewer events happened because of the intervention?” Not in a rhetorical sense. In arithmetic terms. It quantifies the number of events prevented.
That makes it easier to discuss treatment value, side effects, opportunity cost, and patient preferences. It also makes it harder to oversell a weak intervention.
Defining Absolute Risk Reduction
Absolute risk reduction, or ARR, is the difference between the event rate in a control group and the event rate in a treated group.
The formula is:
ARR = CER – EER
Where:
- CER means control event rate
- EER means experimental event rate
A verified example shows how clean this is. If the control event rate is 10% and the experimental event rate is 6%, then the ARR is 4%, because 0.10 – 0.06 = 0.04. In that same example, the relative risk reduction is 40%, because RRR = ARR / CER = 0.04 / 0.10 (Matthew Marks).
The easiest way to think about it
Think of two hospital wards.
In one ward, patients receive usual care. In the other, patients receive the new intervention. If the bad outcome happens less often in the intervention ward, ARR is the gap between those two event rates.
It is not a ratio. It is not a multiplier. It is a subtraction problem.
That is why ARR often feels more intuitive. It tells you the actual drop in probability.
ARR versus RRR
Relative risk reduction answers a different question. It asks how large the reduction is relative to the original baseline.
That can be useful for comparing effects across settings, but it can also magnify the appearance of benefit. A 4 percentage point reduction and a 40% relative reduction can describe the same result. The second sounds larger because it is framed proportionally rather than absolutely.
Here is the distinction in a compact format:
| Measure | Formula | Using CER = 10% and EER = 6% | What it tells you |
|---|---|---|---|
| Absolute Risk Reduction | CER – EER | 4% | The actual difference in event rates |
| Relative Risk Reduction | ARR / CER | 40% | The proportional reduction from baseline |
Key takeaway: If you want to know how much benefit patients really receive, start with ARR. If you want proportional framing, look at RRR after that, not before.
Why ARR travels better into clinical care
At the bedside, absolute numbers are easier to translate into counseling. They also connect directly to another practical measure, the number needed to treat, which depends on ARR rather than RRR.
That is one reason evidence-based medicine leaned heavily on ARR in guideline work and systematic review practice. It disciplines interpretation.
How to Calculate the Absolute Risk Reduction Formula
You do not need advanced biostatistics to compute ARR. You need the event rate in the control group and the event rate in the treatment group.
Step one: identify the events
Pick the outcome of interest first. That could be infection, death, stroke, readmission, or another clearly defined adverse event.
Then count how many patients in each group experienced that event.
Below is a simple teaching table.
Hypothetical Clinical Trial Data for Infection Prevention Drug
| Group | Number of Patients | Number of Infections (Events) | Event Rate (CER or EER) |
|---|---|---|---|
| Control group | 100 | 10 | 10% |
| Treatment group | 100 | 6 | 6% |
Step two: calculate CER and EER
The control event rate is:
CER = events in control group / total control group
From the table above, that is 10 / 100 = 10%.
The experimental event rate is:
EER = events in treatment group / total treatment group
From the table above, that is 6 / 100 = 6%.
Step three: subtract
Apply the formula:
ARR = CER – EER
So:
ARR = 10% – 6% = 4%
That means the intervention lowered the absolute risk of infection by 4 percentage points.
This is the part many readers blur. A 4% ARR is not the same thing as saying “risk became 4%.” It means the risk dropped by 4 percentage points from the original control rate.
Step four: phrase the result in plain English
Biostatistics then becomes clinical communication.
Instead of saying only “the treatment reduced infection risk,” say:
- Among patients who did not receive the intervention, 10% had the event
- Among patients who received it, 6% had the event
- The absolute risk reduction was 4 percentage points
That wording tells the whole story.
A quick check for common mistakes
Students repeatedly make the same few errors:
Mixing up rates and counts
Do not subtract raw event counts unless the group sizes are identical and you are only using that as a shortcut.Confusing percentage points with percent
A drop from 10% to 6% is a 4 percentage point drop. It corresponds to a 40% relative reduction, but those are different statements.Ignoring which group is control
Keep your labels straight. ARR conventionally uses CER – EER.
If you want a second worked explanation of the mechanics, this concise walkthrough on how to calculate Absolute Risk Reduction can help reinforce the arithmetic.
Practical reading tip: If a study gives you event counts but not ARR directly, you can still calculate it quickly from the abstract.
Translating ARR into the Number Needed to Treat
ARR becomes even more useful when you convert it into the number needed to treat, or NNT.
NNT answers a question clinicians really use. How many patients need the intervention for one additional patient to benefit?
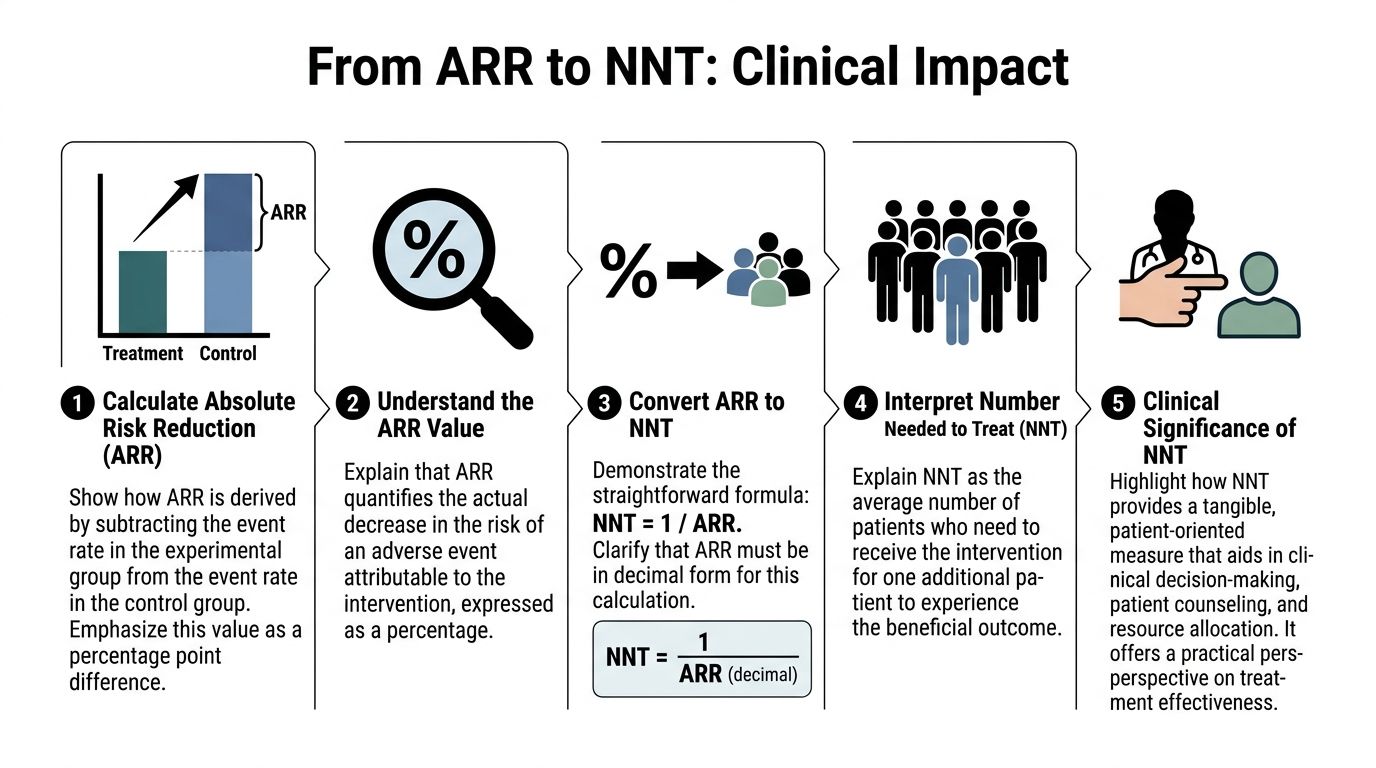
The formula
NNT = 1 / ARR
Use ARR in decimal form, not as a whole-number percentage.
So if ARR is 0.08, then:
NNT = 1 / 0.08 = 12.5
In practice, clinicians usually round up to the nearest whole patient when expressing NNT.
A classic example
A foundational pediatric surgery example reported 20% adverse outcomes in the control group and 12% in the intervention group. That gives an ARR of 8%, or 0.08, and therefore an NNT of 12.5, which is commonly interpreted as about 13 children treated to prevent one adverse outcome (NCBI Bookshelf).
That is a much more tangible statement than a relative effect alone.
Why NNT changes the conversation
NNT translates abstract probability into a patient-centered frame.
Consider how these two statements feel:
- The intervention reduced risk.
- About 13 patients need treatment for one to avoid the adverse outcome.
The second statement gives clinicians, patients, and policy teams something they can reason about. It supports shared decision-making, formulary review, and resource planning.
What a lower or higher NNT implies
A lower NNT generally suggests a larger absolute benefit. A higher NNT suggests a smaller absolute benefit.
But NNT never stands alone. You still need to consider:
- adverse effects
- treatment burden
- patient values
- baseline risk
- cost and logistics
For a quick reference page on the topic, this internal guide on absolute risk reduction is useful: https://www.greenatlanta.com/absolute-risk-reduction/
Interpretive rule: NNT is only as meaningful as the outcome it refers to. Preventing one minor symptom is not the same as preventing one death.
Assessing Reliability Calculating Confidence Intervals
A single ARR value is a point estimate. It is your best estimate from the sample you observed, not a guarantee about the true effect in the larger population.
That is why confidence intervals matter.
Why the point estimate is not enough
Suppose a trial reports a modest ARR. Before trusting it, you want to know how precise that estimate is. A narrow confidence interval suggests more precision. A wide interval suggests more uncertainty.
For ARR, a commonly used approach is:
95% CI = ARR ± 1.96 × SE_ARR
Where the standard error is:
SE_ARR = sqrt[(CER × (1-CER) / n_control) + (EER × (1-EER) / n_experimental)]
A worked example
A verified example uses:
- CER = 0.165
- EER = 0.133
- ARR = 0.032
The estimated standard error is approximately 0.016, and the confidence interval is approximately 0.032 ± 0.031, giving a range that runs from about 0.000 below zero to 0.063 (TLDR Pharmacy).
The arithmetic matters, but the interpretation matters more.
How to interpret the interval
If the confidence interval includes zero, the observed benefit may be due to chance. In plain language, the study does not rule out the possibility of no true benefit.
That does not prove the treatment is ineffective. It means the data are too imprecise to support strong confidence in the estimate.
A quick framework helps:
| CI pattern | Practical interpretation |
|---|---|
| Narrow and fully above zero | Benefit looks more precise |
| Wide but above zero | Benefit is possible, but estimate is unstable |
| Crosses zero | No clear statistical signal of benefit |
| Entirely below zero | Suggests harm rather than benefit |
Where readers often misread confidence intervals
Three mistakes are common.
Treating the point estimate as settled truth
It is only the center of a range of plausible effects.Ignoring sample size
Small studies often produce wider intervals.Reading “not statistically significant” as “no effect”
A study can be inconclusive without proving absence of benefit.
Appraisal habit: Never quote an ARR from a trial without asking how precise the estimate is and whether the interval crosses zero.
Confidence intervals keep you honest. They stop you from confusing a promising number with a dependable one.
Interpreting ARR for Clinical and Administrative Decisions
The same ARR can mean very different things depending on who sits in front of you and what system must pay for the intervention.

Baseline risk changes the meaning
A verified low-risk example makes the point sharply. If a drug produces a 30% relative risk reduction in a population with a 1% baseline risk, the ARR is only 0.3% and the NNT is 333 (WMJ).
The relative framing sounds strong. The absolute framing tells you something else. You would need to treat many people for one to benefit.
That is not automatically a bad intervention. It may still make sense if the treatment is safe, inexpensive, and aligned with patient goals. But ARR keeps the discussion grounded.
What clinicians should ask
When you interpret ARR in practice, ask these questions:
How high is the patient’s baseline risk?
A modest relative effect can become clinically meaningful in a higher-risk person.What outcome is being prevented?
Preventing a severe event may justify more treatment burden than preventing a minor one.How certain is the estimate?
Return to the confidence interval before making a strong claim.
What administrators should ask
Hospital leaders and formulary committees use ARR differently. They often need to decide whether an intervention deserves broad adoption.
That requires more than statistical significance. It requires judgment about operational value.
A practical checklist:
| Decision lens | Why ARR helps |
|---|---|
| Resource allocation | It shows the actual event reduction expected in the treated population |
| Cost-effectiveness | It clarifies how much benefit is purchased for the effort and expense |
| Population targeting | It helps identify groups where baseline risk is high enough to justify use |
| Patient counseling | It supports plain-language explanations of likely benefit |
Personalized medicine depends on absolute thinking
In this context, ARR becomes more than a trial metric. It becomes part of individualized care.
A therapy with modest absolute benefit in a low-risk patient may be more compelling in a high-risk patient. The relative effect may look similar across both groups, but the absolute payoff can differ substantially because the baseline risk differs.
That is why reading only the headline effect is dangerous. You need to ask who was studied, how often the event occurred in the control group, and whether your patient resembles that group.
Most useful question in clinic: “Given this patient’s baseline risk, how much absolute benefit are we really offering?”
For administrators, the same logic applies at the population level. Broad deployment makes more sense when the treated population has enough baseline risk for the intervention’s absolute benefit to matter.
Conclusion Putting ARR into Practice
The absolute risk reduction formula is simple. Its consequences are not.
When you use ARR, you stop letting relative framing dominate your judgment. You ask what changed in concrete terms. You quantify the events prevented. You ask whether the estimate is precise enough to trust. Those habits improve both clinical reasoning and patient communication.
Keep three principles close at hand:
- Ask for absolute event rates
- Translate ARR into NNT when possible
- Interpret every result in light of baseline risk and confidence intervals
Relative measures still have a role, but they should not lead the conversation. ARR is the metric that most directly answers the question patients and clinicians care about. What real difference does this intervention make?
If you train yourself to think in absolute terms, you become a better reader of trials and a better steward of treatment decisions.
Frequently Asked Questions About Risk Reduction
Some questions come up every time students start using ARR in real papers. The short answers below usually clear the fog.
FAQ on Risk Reduction Metrics
| Question | Answer |
|---|---|
| What if the treatment increases risk instead of lowering it? | The arithmetic still works. The difference would indicate harm rather than benefit. Clinicians then focus on absolute risk increase rather than reduction. |
| Is relative risk reduction ever useful? | Yes. It can help describe proportional effect size. It becomes misleading only when readers see it without the baseline event rates or ARR. |
| Why does baseline risk matter so much? | Because the same proportional effect can produce very different absolute benefits in low-risk and high-risk groups. |
| Is a high NNT always bad? | Not necessarily. It depends on the severity of the outcome, the safety of the treatment, treatment burden, and context. |
| If a confidence interval crosses zero, should I ignore the study? | No. It means the study is inconclusive about benefit, not automatically worthless. You should interpret it with caution and look at the full evidence base. |
| Can I compare ARR across studies directly? | Carefully. ARR depends heavily on baseline risk, outcome definition, follow-up period, and patient population. |
| Why do guideline panels care about ARR and NNT? | Because those measures are easier to connect to patient benefit, tradeoffs, and policy decisions than relative metrics alone. |
Atlanta organizations that care about both compliance and community impact can explore Atlanta Green Recycling for secure electronics recycling and IT asset disposition. Their Atlanta-focused service model is especially relevant for businesses, schools, healthcare groups, and public agencies that need responsible e-waste handling, documentation, and a mission-driven approach tied to veteran support and tree planting.